
The Problem
You are a solutions architect at a company with fifty AWS accounts in an Organization and thousands of S3 buckets. Some buckets have not been touched in months. Others are silently growing at hundreds of GB per day.
You need to identify unused or rarely accessed buckets to drive storage cost optimization, with the least operational overhead.
The Solution
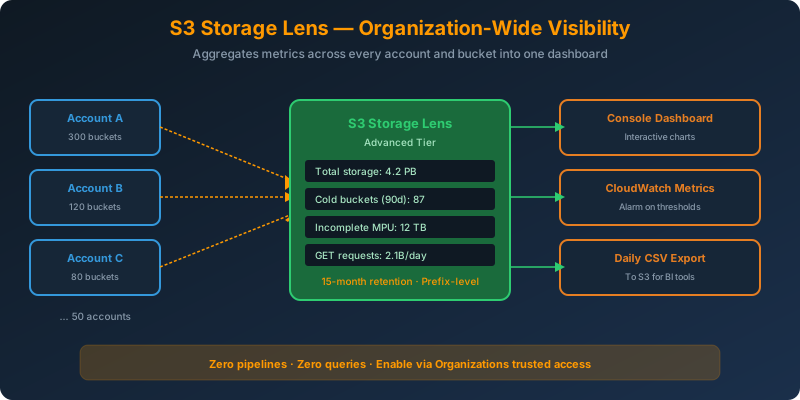
Use S3 Storage Lens with the advanced tier. It aggregates usage and activity metrics across every account in your Organization into a single, purpose-built dashboard. No pipelines to build, no queries to write, no CloudTrail parsing.
How It Works
What Storage Lens Provides
Storage Lens is S3’s built-in analytics service. It aggregates metrics daily and exposes them through:
- An interactive dashboard in the S3 console
- CloudWatch metrics you can alarm on
- Daily CSV or Parquet exports to an S3 bucket for BI tools
It answers questions like:
- Which buckets grew the most this month?
- Which prefixes have not been read in 90 days?
- What percentage of my data is in cold storage classes?
- Where are my incomplete multipart uploads costing me money?
Free Tier vs Advanced Tier
| Feature | Free | Advanced |
|---|---|---|
| Metrics count | ~14 usage metrics | ~28+ metrics (usage + activity) |
| Retention | 14 days | 15 months |
| Prefix-level aggregation | No | Yes |
| Activity metrics (GET/PUT counts, retrieval bytes) | No | Yes |
| CloudWatch publishing | No | Yes |
| Cost | Free | Per-object-monitored fee |
Activity metrics answer “what is being accessed.” They live only in the advanced tier. Free-tier usage metrics tell you what you have; advanced tier tells you what is being used.
Creating an Organization-Wide Dashboard
Enable trusted access from the management account first:
1
2
aws organizations enable-aws-service-access \
  --service-principal storage-lens.s3.amazonaws.com
Then create the dashboard:
1
2
3
4
5
6
7
8
9
10
11
12
13
14
15
16
17
18
19
20
21
22
23
24
25
26
27
28
29
30
31
32
33
34
35
aws s3control put-storage-lens-configuration \
  --account-id 111122223333 \
  --config-id org-wide-lens \
  --storage-lens-configuration '{
    "Id": "org-wide-lens",
    "AccountLevel": {
      "ActivityMetrics": { "IsEnabled": true },
      "BucketLevel": {
        "ActivityMetrics": { "IsEnabled": true },
        "PrefixLevel": {
          "StorageMetrics": {
            "IsEnabled": true,
            "SelectionCriteria": {
              "Delimiter": "/",
              "MaxDepth": 5,
              "MinStorageBytesPercentage": 1.0
            }
          }
        }
      }
    },
    "DataExport": {
      "S3BucketDestination": {
        "Format": "CSV",
        "OutputSchemaVersion": "V_1",
        "AccountId": "111122223333",
        "Arn": "arn:aws:s3:::storage-lens-export",
        "Prefix": "org-wide-lens/"
      }
    },
    "IsEnabled": true,
    "AwsOrg": {
      "Arn": "arn:aws:organizations::111122223333:organization/o-abc123"
    }
  }'
Within 48 hours, the dashboard populates with metrics from every account, every bucket.
Identifying Cold Buckets
Sort the dashboard by “GetRequests” over 90 days. Buckets at zero are candidates for:
- Moving to S3 Glacier Deep Archive
- Applying an aggressive lifecycle policy
- Deleting outright if the data is no longer needed
Combine with the “IncompleteMultipartUploadStorageBytes” metric to find abandoned uploads costing you money.
Why Not the Alternatives?
S3 console dashboard: Lists buckets and shows basic properties, but has no cross-account aggregation and no activity metrics.
CloudWatch BucketSizeBytes + Athena: CloudWatch metrics show size only, not access patterns, and you cannot query them with Athena.
CloudTrail S3 data events + CloudWatch Logs Insights: Technically possible, but painful. Data events are expensive, log volume is large, and you have to write your own aggregation. Storage Lens does this out of the box.
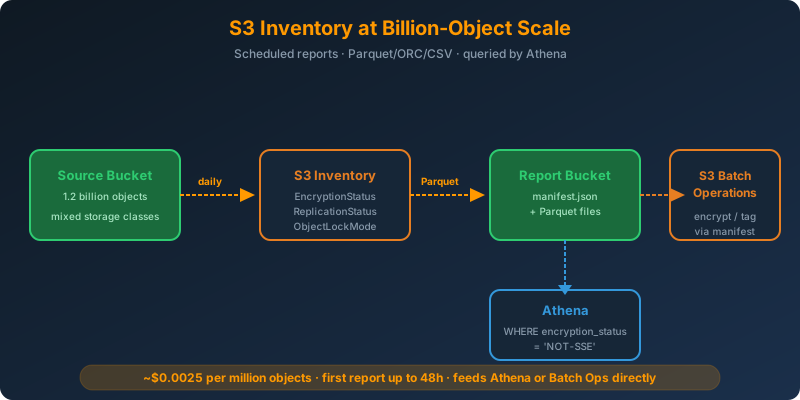
S3 Inventory reports: Great for per-object listings and encryption status, but not for activity trending or cross-account rollups.
Key Takeaways
- S3 Storage Lens is the purpose-built tool for organization-wide S3 analytics
- Advanced tier unlocks activity metrics, prefix-level aggregation, and 15-month retention
- Enable trusted access in Organizations first, then create the dashboard from the management account
- Use it to find cold buckets, abandoned multipart uploads, and unused prefixes for cost optimization
- Zero pipelines, zero queries — the dashboard is ready inside 48 hours
 Never miss a story from us, subscribe to our newsletter